Inline quality control vs final inspection with AQL
Most garment factories in Egypt still treat quality as something that happens at the end. Pieces come off the line, a team of checkers goes through them before packing, defects are pulled out and sent back for repair. Then the buyer's inspector arrives, draws a sample by AQL, and either passes the shipment or fails it.
That model works, but it is expensive. By the time a defect is found at final inspection, it has been repeated on every piece sewn since the operator first made the mistake. If an operator sets the wrong stitch density at 8 a.m. and nobody notices until packing, you may have 600 pieces to unpick. Inline quality control exists to shorten that loop from a day to an hour.
What final inspection with AQL really tells you
AQL (Acceptable Quality Limit, defined in ISO 2859-1) is a sampling plan, not a quality method. It answers one question: given a sample of this size, is the whole lot likely to be at or below an agreed defect rate? It does not find every defect, and it is not supposed to.
A typical plan for a lot of 3,000 pieces at General Inspection Level II uses code letter K, which means a sample of 125 pieces. At AQL 2.5 for major defects, the lot passes with up to 7 defective pieces and fails at 8. At AQL 4.0 for minor defects, it passes with up to 10 and fails at 11.
| Lot size | Sample (Level II) | AQL 2.5 accept / reject |
|---|---|---|
| 501 to 1,200 | 80 | 5 / 6 |
| 1,201 to 3,200 | 125 | 7 / 8 |
| 3,201 to 10,000 | 200 | 10 / 11 |
The key point is that AQL is a verdict on a finished lot. When it fails, your only options are 100% re-inspection, repair, and a late shipment. It is the right tool for the buyer, and for your own final audit, but it is the wrong tool for preventing defects.
What inline quality control does differently
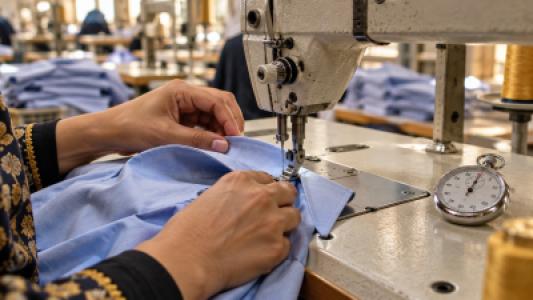
Inline QC moves the checking to where the work is done. The most common method in garment factories is the traffic-light system: an inline inspector visits each operator several times a day, checks a small random sample, usually 7 pieces, and marks a card at the workstation.
- Green: 0 defects in 7 pieces. The operator continues, and the next visit can wait.
- Yellow: 1 defect. The inspector shows the operator the fault and returns sooner.
- Red: 2 or more defects. The operation stops until the supervisor or mechanic fixes the cause, whether it is the method, the machine or the material.
Operators who stay green for several rounds are visited less often, so the inspector's time concentrates on the people and operations that need it. New operators, complex operations like collar attachment or pocket setting, and machines that were just repaired get the most attention. This is also where a two-week training plan for new operators pays off: fewer reds in their first month.
Where defects come from, and where to look
When you start recording inline results, a pattern appears quickly. In most sewing lines, three or four operations produce the majority of defects. Applying the same logic as a Pareto analysis of breakdown causes to your defect data tells you where to put your best inspector and your best mechanic.
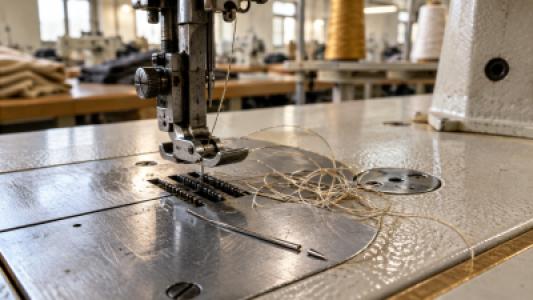
Many repeat defects are not the operator's fault at all. Skipped stitches, uneven tension and needle damage often trace back to a machine that needs attention. A line that logs malfunctions properly can match a spike in skipped stitches on Tuesday with a machine that was reported and repaired on Wednesday. That link is invisible if quality and maintenance keep separate notebooks.
Finding the right proportion
Neither approach is enough on its own. Final inspection without inline checks catches defects too late; inline checks without final inspection leave you exposed to packing errors, measurement drift and the occasional bad batch that slipped through. A practical split for a factory of 150 to 300 operators looks like this:
- One inline inspector for every 20 to 30 operators, focused on the traffic-light rounds.
- End-of-line checking at a smaller scale than before, because fewer defects arrive there.
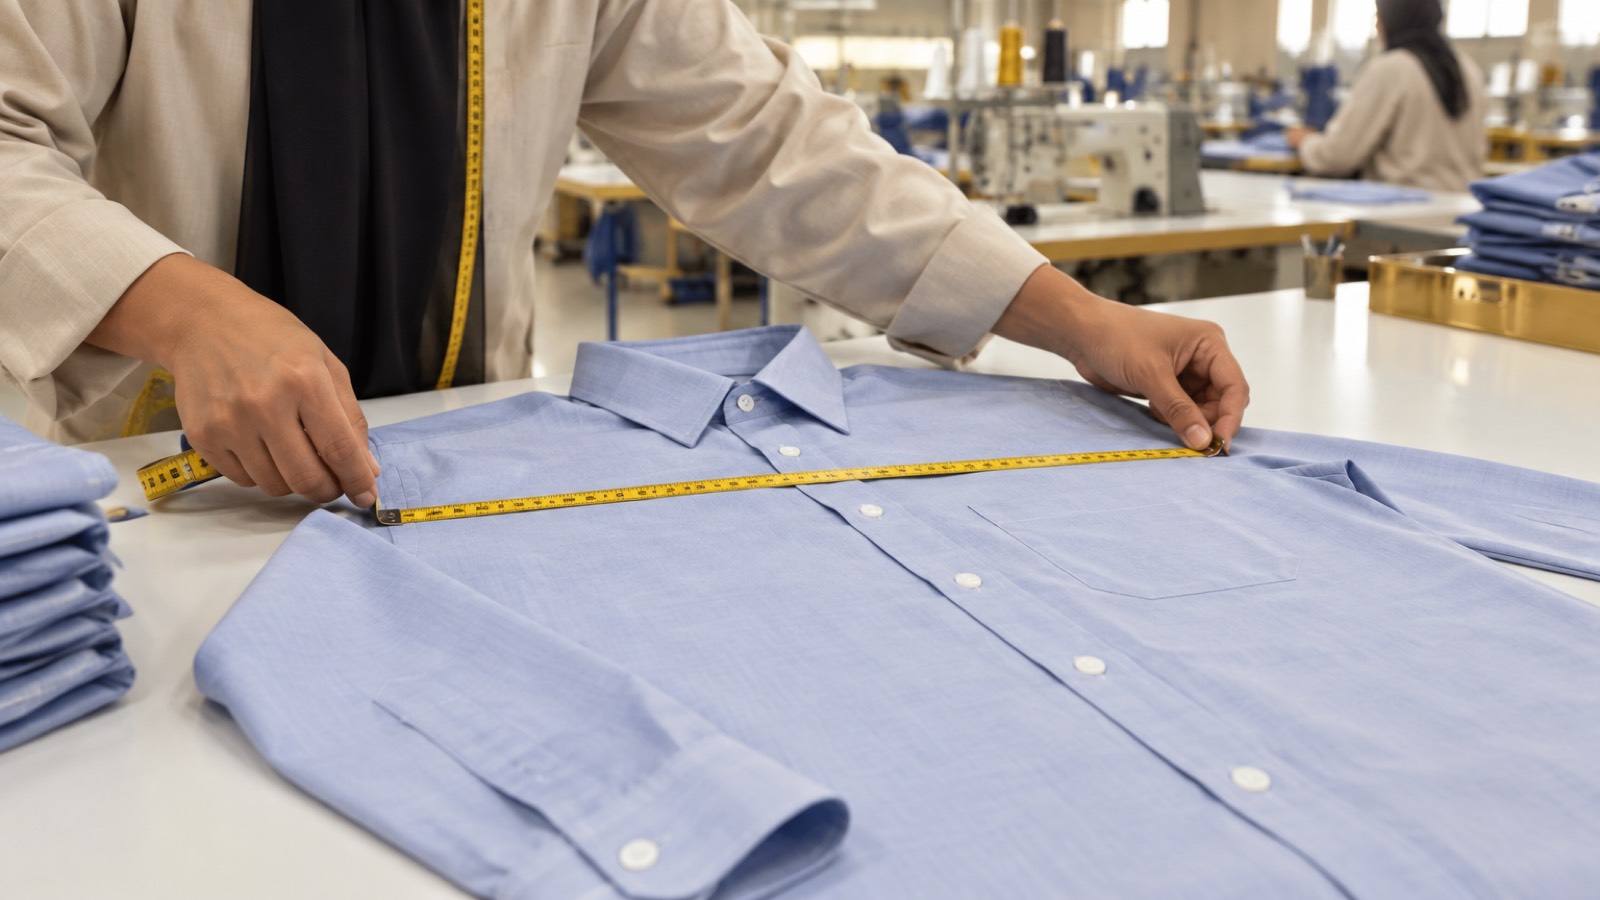
- An internal AQL audit on every lot before the buyer's inspection, using the same plan and the same defect definitions as the buyer.
Factories that make this shift usually see end-of-line defect rates fall from around 8 to 10% to 3 to 4% within two or three months. The final checkers are not eliminated; they simply spend less time sorting and more time verifying.
Measuring quality without blaming people
Inline data is powerful, and it can be misused. If every red card becomes a public reprimand, operators hide defects, and the data stops being true. Use the numbers to find causes, not culprits. The same principles we describe in measuring operator performance without demotivating your team apply here: share results privately, focus on trends rather than single days, and pair every red card with a fix.
At management level, keep three numbers in view: the inline defect rate by operation, the end-of-line defect rate per line, and the first-time pass rate at final AQL audit. If the first two fall and the third rises, your inline system is working.
How Nasij supports a quality routine
Nasij is not a quality inspection system, and it does not score AQL samples. What it gives a quality team is the context around the defects. Production tracking by stage shows live balances, so you can see exactly how many pieces are sitting between sewing and finishing when a red card stops an operation. Malfunction logs with predefined reasons let you match recurring defects to machines that keep breaking down, and each machine's QR sticker lets anyone on the floor open its history with a phone. When pieces are rejected beyond repair, recording them as loss keeps your work-in-progress balances honest, so the count you promise the buyer matches the count you can ship.