
7 daily numbers every factory owner should see
Factory owners are rarely short of data. They are short of the right data at the right time. A weekly report with forty pages arrives too late to act on, and a dashboard with a hundred charts gets opened once and forgotten. What actually helps is a short list of numbers that you look at every morning, before the first tea, and that tell you where to walk first when you reach the floor.
The seven numbers below are chosen for a typical Egyptian garment factory with a few sewing lines, a cutting room and a material store. Each one is simple to calculate, each one changes daily, and each one points to a specific action when it moves the wrong way.
1. Yesterday's output against plan
The first number is the simplest: how many finished pieces left the last production stage yesterday, compared with the plan. Count at the terminal stage, not at packing or by estimate. If Line 3 was planned for 1,200 polos and finished 1,020, that is 85% of plan, and you want to know why before 9 a.m., not on Thursday.
Look at it per line and per order. A factory total of 96% can hide one line at 70% that will miss its shipment.
2. Line efficiency
Output alone does not tell you whether the line worked well, because a simple T-shirt and a lined jacket cannot be compared by piece count. Efficiency fixes that: (pieces produced × SMV) ÷ (operators × minutes worked) × 100. A line of 30 operators working 480 minutes on a 12-minute garment that produced 840 pieces runs at (840 × 12) ÷ (30 × 480) = 70%.
Most Egyptian sewing lines run between 45% and 65%. The trend matters more than the level. If you have not set up SMV yet, our guide to SMV and line efficiency walks through it step by step.
3. Work in progress by stage
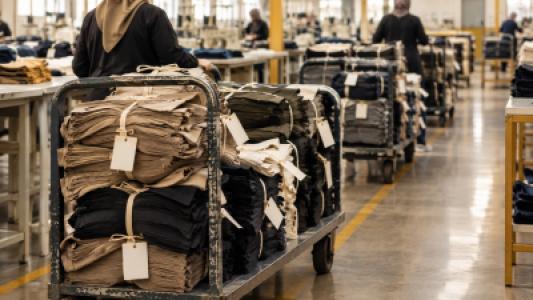
How many pieces are sitting between cutting and sewing, between sewing and finishing, and between finishing and packing? A healthy line has a small, steady buffer in front of each stage. When one number keeps growing, the stage after it is your bottleneck.
For example, if the balance waiting for finishing goes from 400 pieces on Sunday to 1,900 on Wednesday, finishing cannot keep up, and adding operators to sewing will only make the pile larger. This is the single most useful number for finding where the real bottleneck is.
4. Material loss rate
Fabric is usually 50 to 70% of the cost of a garment, so a small change in loss is a large change in profit. Track the loss recorded yesterday as a percentage of material issued, by order. If an order normally loses 3% and yesterday showed 6%, check the cutting room today, while the remnants are still on the table.
This number only works if loss is recorded when it happens, with a reason, rather than discovered at month-end as a gap in the store balance.
5. Machines down and open malfunctions
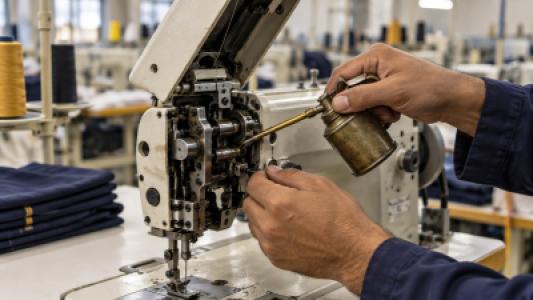
How many machines are out of service this morning, and how many malfunctions were reported yesterday? One broken overlock on a line of 30 machines can cut output far more than its share if it sits on a critical operation.
Watch two details: machines that have been down for more than 24 hours, and machines with more than two malfunctions in the past week. The first is a spare-parts or mechanic problem; the second is a candidate for preventive work. Over time, these daily counts become the raw data for MTBF and MTTR.
6. End-of-line defect rate
What percentage of pieces checked at the end of each line yesterday had a defect? A steady 3 to 4% is reasonable for many products. A jump from 3% to 9% on one line usually has a single cause: a new operator on a critical operation, a machine with tension problems, or a new fabric lot. Catching it the next morning saves a day's worth of rework.
7. Attendance against plan
Finally, how many operators came to work compared with the number each line needs? Absence is the hidden cause behind many of the other six numbers. A line planned for 32 operators that runs with 27 will miss its target no matter how well it is managed. If absence on a specific line keeps rising, it may be a supervisor problem, a pay problem, or simply a hiring gap that needs to be filled.
Turning numbers into a morning routine
The value of these seven numbers comes from looking at them the same way every day. A practical routine:
- Review all seven on one page, before walking the floor.
- Mark anything outside its normal range, and nothing else.
- Pick no more than two issues to follow up personally that day.
- Share the line-level numbers with supervisors privately, as we recommend in measuring performance without demotivating your team.
Within a few weeks, you will know what normal looks like for your factory, and anything unusual will stand out immediately.
Where these numbers come from in Nasij
Several of these numbers come straight from records Nasij already keeps. Production tracking by stage gives you live balances, so work in progress and the output of the final stage are visible without anyone compiling a sheet. Material intake, issue, return and loss movements give you the loss rate by order, with the reason attached. Malfunction logs, recorded with predefined reasons and linked to each machine through its QR sticker, show which machines are down and which keep failing. Efficiency, defect rate and attendance are calculated from your own line data. And when you want to share a summary with a partner or a client, the reports export as properly rendered Arabic PDFs.